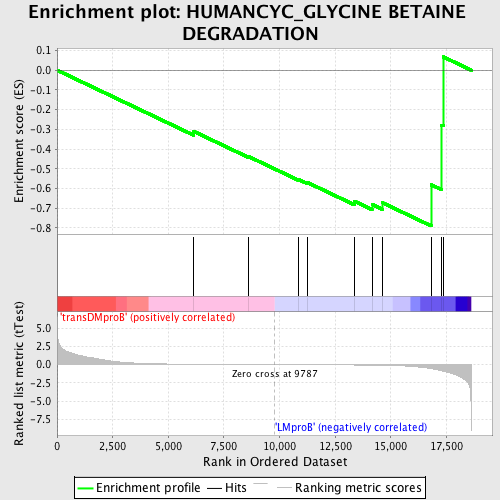
Profile of the Running ES Score & Positions of GeneSet Members on the Rank Ordered List
| Dataset | Set_04_transDMproB_versus_LMproB.phenotype_transDMproB_versus_LMproB.cls #transDMproB_versus_LMproB |
| Phenotype | phenotype_transDMproB_versus_LMproB.cls#transDMproB_versus_LMproB |
| Upregulated in class | LMproB |
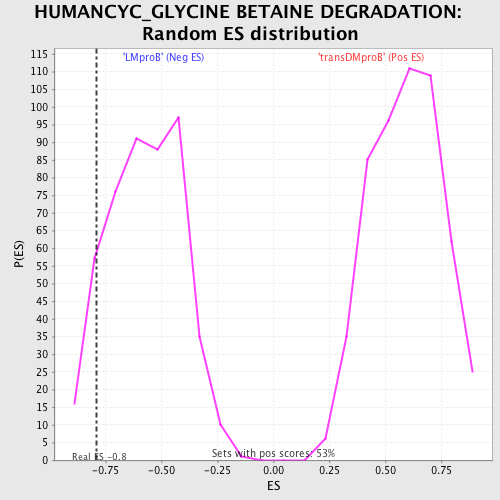
| GeneSet | HUMANCYC_GLYCINE BETAINE DEGRADATION |
| Enrichment Score (ES) | -0.7904439 |
| Normalized Enrichment Score (NES) | -1.3882985 |
| Nominal p-value | 0.08492569 |
| FDR q-value | 1.0 |
| FWER p-Value | 1.0 |
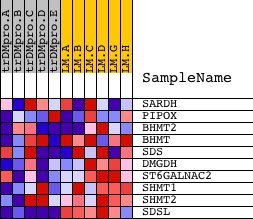
| PROBE | DESCRIPTION (from dataset) | GENE SYMBOL | GENE_TITLE | RANK IN GENE LIST | RANK METRIC SCORE | RUNNING ES | CORE ENRICHMENT | |
|---|---|---|---|---|---|---|---|---|
| 1 | SARDH | 9646 | 6142 | 0.051 | -0.3106 | No | ||
| 2 | PIPOX | 20340 | 8616 | 0.013 | -0.4386 | No | ||
| 3 | BHMT2 | 21391 | 10832 | -0.011 | -0.5534 | No | ||
| 4 | BHMT | 4446 | 11234 | -0.016 | -0.5689 | No | ||
| 5 | SDS | 16722 3582 | 13373 | -0.048 | -0.6654 | No | ||
| 6 | DMGDH | 21585 | 14159 | -0.069 | -0.6811 | Yes | ||
| 7 | ST6GALNAC2 | 20138 | 14622 | -0.087 | -0.6725 | Yes | ||
| 8 | SHMT1 | 5431 | 16818 | -0.543 | -0.5815 | Yes | ||
| 9 | SHMT2 | 3307 19601 | 17288 | -0.852 | -0.2786 | Yes | ||
| 10 | SDSL | 16401 | 17357 | -0.909 | 0.0677 | Yes |